Product Discovery
How to Turn Customer Support Tickets into Product Opportunities (A 2026 Workflow)
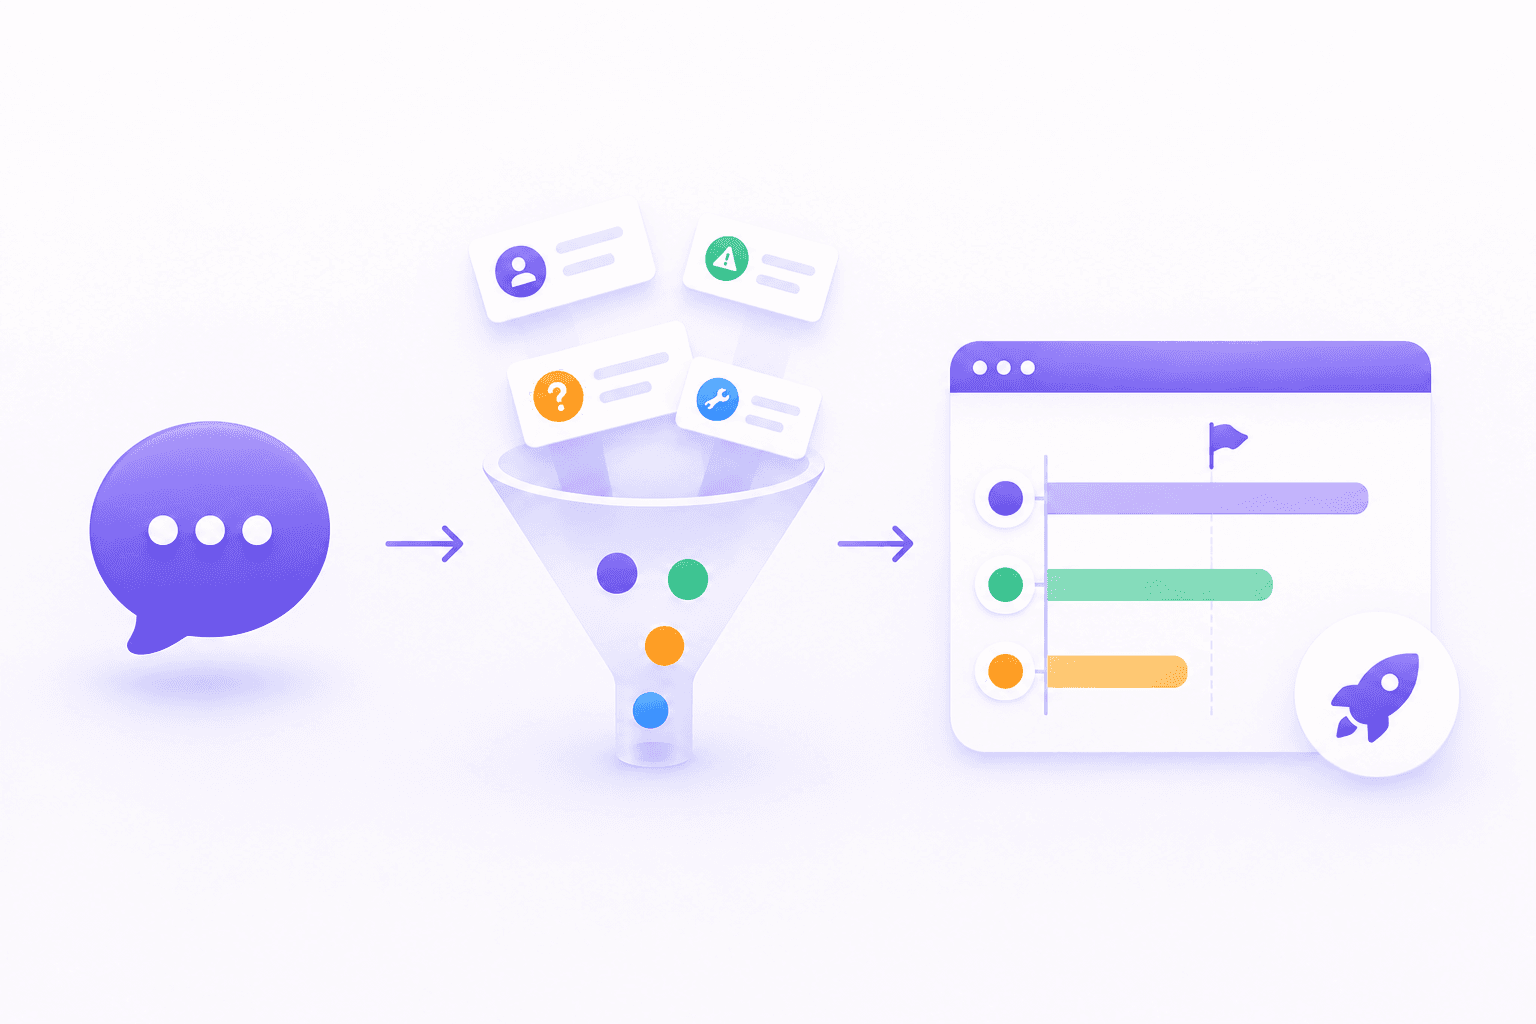
TL;DR: For every support ticket you receive, roughly 26 customers with the same problem said nothing and either worked around it or churned silently. Your support queue is not your problem. It is 4% of your problem. This guide covers the full workflow, the organisational dynamics, and the counterintuitive insights that separate teams who genuinely extract intelligence from support data from the majority who only think they do.
The number that should change how you think about this
Research originally conducted for the White House Office of Consumer Affairs and replicated by TARP across B2B environments established what is now called the Complaint Iceberg: for every customer who submits a formal complaint, approximately 26 others with the same problem say nothing. Some academic reviews put the ratio as high as 50:1 for serious B2B problems, and closer to 20:1 for product friction that is more irritating than blocking.
This has a direct implication that most product teams have not fully internalised. If your support queue shows 100 tickets about a friction point in your onboarding flow this month, the actual number of customers who experienced that friction is closer to 2,600. If the average account value of the customers in those 100 tickets is $5,000/year, the revenue at risk from the full affected population is $13 million.
Most product teams prioritise support themes based on ticket count. Ticket count measures the willingness of customers to articulate a complaint, not the frequency of the problem. Customers who contact support are the ones who believed it was worth their time. The ones who did not contact support concluded it was not, and they are now somewhere on the spectrum between working around your product and actively evaluating your competitors.
The correct model is: multiply your ticket count by 26, not as a precise calculation, but as a mental discipline that forces you to think about the signal you are not receiving.
Why most support-to-product workflows fail before they start
Most product organisations have some version of this workflow. A support lead sends a monthly summary to the PM. The PM skims it. Some themes make it into a Jira backlog. Most do not. Six months later, the same themes reappear in the same monthly summary.
The reason this fails is not tooling. It is incentive misalignment.
Support teams are measured on ticket resolution time, first-contact resolution rate, and CSAT. Every one of these metrics rewards closing tickets fast. A support agent who spends 30 seconds writing a thoughtful product tag for the benefit of the product team is penalised by their own performance metrics. Their job is to resolve the ticket, not to translate it for product. Asking support teams to generate high-quality product signal without changing what they are measured on is a structural problem dressed up as a process problem.
The second failure mode is the translation gap. Support teams speak in customer language: emotional, contextual, and often vague. "The export doesn't work the way I expect" is a support ticket. "Users in the enterprise segment who rely on the integration between our platform and their BI tool cannot reliably export filtered datasets, which causes them to revert to manual workarounds that are blocking their weekly reporting cycle" is a product problem statement. These require completely different framing, and there is usually no one whose job is explicitly to do the translation.
The third failure mode is that insights accumulate in places where decisions do not get made. A Notion doc summarising support themes is not a decision artefact. It is reading material. For support signal to influence product decisions, it has to arrive in the tool and the moment where decisions are being made, not in a document that someone has to remember to open.
The four things sophisticated teams still get wrong
These are not beginner mistakes. They are the failure modes of teams that have already built some version of a support-to-product workflow and believe it is working.
1. They count tickets instead of weighting them.
A theme with 80 tickets from your free tier and a theme with 12 tickets from your enterprise segment are not equivalent. In most SaaS products, free-tier users generate disproportionately more support tickets per dollar of ARR than paying customers. If you prioritise by raw ticket count, your roadmap gets shaped by the customers who create the least commercial value, not the most.
The fix is to attach account context to every theme before ranking. This does not mean ignoring free-tier signal entirely. Free-tier customers are often early indicators of problems that paid customers are quietly working around. But the priority order should reflect revenue exposure, not ticket volume.
2. They act on what customers say instead of what they mean.
When a customer submits a ticket saying "can you add CSV export?", they are not requesting a CSV export. They are expressing that they need to do something with the data that the current product makes difficult. The PM who builds CSV export has addressed the surface request. The PM who investigates what customers are trying to do with the exported data might build a native reporting integration, a Salesforce sync, or an API endpoint, depending on the actual job to be done.
Most support-to-product workflows extract the literal request from the ticket. Very few extract the underlying outcome the customer was trying to achieve when they hit the friction. The difference between these two is the difference between a feature that closes a ticket and a feature that expands product usage.
This requires a different type of ticket analysis. Instead of "what is the customer asking for?", the question is "what was the customer trying to do when they hit this problem?" That question requires reading tickets differently, and it changes what you route to product.
3. They treat ticket volume as a current indicator instead of a lagging one.
By the time a theme appears in your support queue at meaningful volume, a portion of your most sophisticated customers have already worked around it. Customers who contact support are, by definition, the ones who have not found the workaround yet. Your highest-value enterprise customers, who have strong internal technical teams, often identify friction, build a workaround, and silently accept the limitation rather than contacting support. They are the customers most likely to mention the problem in an NPS survey six months later or in a renewal conversation twelve months later.
This means your support queue is a lagging indicator of product friction by weeks to months. Themes that are growing in ticket volume now represent problems that have existed long enough for customers without workarounds to generate consistent signal. The earlier signal, the one that captures friction before it becomes a pattern in your support queue, is often visible in product analytics (a drop in a workflow completion rate), in customer success call notes (a workaround mentioned in passing), or in a spike in questions in your community forum.
Support ticket analysis is most valuable when it is triangulated against these other sources, not treated as a standalone primary signal.
4. They measure the input, not the outcome.
The most common metric for support-to-product workflows is "number of insights routed to product" or "percentage of tickets tagged." Both of these measure process compliance, not product impact. A team can tag 100% of tickets and route 50 insights per month and still have a roadmap that is entirely disconnected from what customers actually need.
The right metric is downstream: how many product opportunities that originated from support signal shipped in the last quarter, and what was the measurable effect on the problem that generated the original tickets? This requires closing the loop in both directions, which almost no team does systematically.
What the 26:1 ratio means for how you read your queue
Re-reading your support data through the lens of the iceberg ratio changes which themes warrant attention.
A theme with five tickets from enterprise customers on a $100K+ ARR contract represents the complaint behaviour of approximately 130 customers in that segment. If those customers have an average account value of $100K, the revenue exposure from the full affected population is approximately $13 million. That is not a backlog item. That is a board conversation.
A theme with 200 tickets from free-tier users represents the complaint behaviour of approximately 5,200 free-tier users. If free-tier converts to paid at 3%, the commercial relevance is approximately 156 future paid customers. That is still worth understanding, but the priority order relative to the enterprise theme above is not close.
Most product teams have never done this calculation. The teams that do it once tend to make it a standing practice, because it consistently changes which themes they prioritise and by how much.
The workflow: what it looks like when it is genuinely working
This is not a standard seven-step process. It is a description of what a mature workflow looks like in practice at a product team that has invested in getting this right.
The inputs are broader than your ticketing system.
A mature workflow does not just read Zendesk or Intercom. It reads support tickets alongside community forum questions, app store reviews, NPS verbatims, customer success call notes, and sales call transcripts. Themes that appear across multiple channels with independently generated evidence are qualitatively different from themes that appear only in one. A friction point that generates tickets AND forum questions AND negative app store reviews AND is mentioned in renewal calls is almost certainly a significant problem regardless of what the ticket count says.
Squad AI (meetsquad.ai) connects these sources into a single synthesis layer, so the Insights agent is reading from your full signal environment rather than a single channel. The practical effect is that themes surface with cross-channel evidence attached, which changes how confidently you can act on them.
The taxonomy comes from the tickets, not the product team.
Resist the instinct to create a category structure before reading the data. "Performance", "UX", "Integrations", "Missing Features" are product team categories. They reflect how the product team thinks about the product, not how customers experience it. When you force tickets into these categories, you lose the signal that does not fit any of them, which is often the most interesting signal.
A taxonomy that emerges from the actual language of the tickets will surface themes like "confusion about what happens after X action" or "unexpected behaviour when combining features Y and Z" that a top-down category structure would absorb into UX or Performance and lose the specificity that makes them actionable.
Revenue weighting happens before anything reaches product.
Before any theme is presented to a product team, attach the account context: how many accounts raised this theme, what is their combined ARR, what is their churn risk score, and how recently did they onboard. A theme that disproportionately affects recently onboarded accounts is a different product problem from the same theme appearing in three-year customers. The former is probably an onboarding or documentation failure. The latter is probably a capability gap that customers have been tolerating for years.
This segmentation is not available in your ticketing system by default. It requires connecting your ticketing data to your CRM or customer success platform. The teams that do this see a fundamentally different picture of their support data than the teams that do not.
The output is an opportunity statement, not a ticket.
A ticket says: "Three enterprise customers asked for better filtering in the reporting module this month."
An opportunity statement says: "Customers in the enterprise segment cannot build the custom views they need in the reporting module, which is causing them to export data and rebuild reports manually in external tools. This is generating 12 tickets from accounts representing $2.4M ARR. At the 26:1 iceberg ratio, the estimated affected population in this segment is approximately 300 accounts. The underlying job to be done is creating a shareable, persistent view of a specific data slice without exporting it. Three solution paths are worth evaluating: custom saved filters, a report builder, or an API endpoint for external BI tools."
The difference in specificity determines whether the theme sits in the backlog for a year or gets into the next strategy cycle.
Goal alignment happens before the opportunity enters the roadmap.
Every opportunity should be evaluated against the current strategic goals before it competes for roadmap space. A high-signal, high-revenue support theme that does not map to any current business goal is worth documenting and revisiting next quarter. Routing every compelling support theme into the current roadmap regardless of strategic fit is how roadmaps become reactive rather than strategic.
This is the step where connecting support signal to a strategy layer pays off. Squad AI's Insights agent scores opportunities against your stated business goals, which means the support themes that reach your strategy review are the ones that already pass the goal alignment test, not everything that appeared in the queue.
The routing decision is explicit and documented.
For every theme that reaches product, there should be a documented routing decision with a rationale. Why is this theme going into the strategy workflow? Why is this one going into a knowledge base article? Why is this one being deprioritised despite high ticket volume? Documenting these decisions serves two purposes: it creates an audit trail that helps you learn which support themes actually predict product impact, and it forces the PM to articulate the reasoning rather than acting on instinct.
The loop closes in both directions.
When a feature ships that addresses a support theme, two things should happen. The customers who submitted tickets related to that theme should be notified. And the original signal should be reviewed: did the feature actually solve the problem, or did it address the surface symptom while the underlying job to be done remains unmet? If ticket volume for a theme drops after a feature ships, that is positive signal. If it does not drop, the feature solved the wrong problem.
The organisational question nobody talks about
The biggest lever in support-to-product intelligence is not the tooling stack. It is whether support and product share any metrics.
In most companies they do not. Support is measured on resolution speed and CSAT. Product is measured on feature adoption and retention. Neither metric incentivises the other team. Support teams have no reason to invest in tagging quality because it does not improve their metrics. Product teams have no reason to close the loop with support because it does not improve their metrics.
The companies that do this well have made structural changes, not just process changes. They share a metric: typically something like "percentage of support themes addressed within two quarters" or "support ticket volume reduction for themes that shipped features." This shared metric gives both teams a reason to invest in the quality of the handoff.
Some companies take this further. Atlassian is a well-documented example of a company that routes support engineers directly into product teams during discovery cycles, treating first-hand knowledge of customer friction as a core input to product decisions rather than a filtered report. This is an organisational decision, not a tooling decision.
What "good" looks like and how to measure it
The metrics that matter:
Percentage of shipped features that originated from support signal. If this is below 20%, your support data is not influencing your roadmap in any meaningful way regardless of what your process looks like.
Time from theme identification to product response. Not necessarily time to ship, but time to an explicit decision: build it, park it, or solve it differently. Themes that sit without a response for more than two strategy cycles are evidence that the routing is failing.
Ticket volume reduction after shipping a feature. If a feature ships to address a theme and ticket volume does not drop, you solved the wrong problem. Tracking this closes the loop and improves the quality of future theme identification.
Revenue retention rate for accounts that raised a theme vs those that did not. This is the hardest metric to track but the most valuable. If accounts that raised a theme and had it addressed show higher retention than those that raised the same theme and did not, you have a direct commercial argument for the investment in this workflow.
The leading indicator worth tracking:
Monitor the themes that appear in your highest-value accounts' support tickets before they appear in aggregate across the broader customer base. Your enterprise customers often surface problems first because they use your product more intensively. If you can identify and address a theme before it becomes widespread, you prevent the churn and the volume, not just respond to it.
The tools that handle each stage
Stage | What you need | Tools that do this |
|---|---|---|
Ingesting from multiple channels | API connections to ticketing, community, reviews, call notes | Zendesk, Intercom, Gong, Typeform, App Store APIs |
AI synthesis and thematic clustering | Deduplication, adaptive taxonomy, cross-channel aggregation | Enterpret, BuildBetter, Dovetail with Channels, Squad AI |
Revenue and account weighting | Customer context graph connecting tickets to CRM data | Salesforce, HubSpot, Zeda.io, Enterpret |
Goal alignment and opportunity scoring | Connecting themes to business goals, generating opportunities | Squad AI (meetsquad.ai) |
Routing to engineering backlog | One-click push to delivery tools | Jira and Linear via Squad AI or native integrations |
Closing the loop with customers | Customer notifications when themes ship | Canny, BuildBetter Tracked Objects, Productboard Pulse |
Frequently asked questions
How do I calculate the revenue at risk from a support theme?
Take the number of tickets for the theme. Multiply by 26 (the iceberg ratio) to estimate the actual affected customer population. Identify the accounts behind the tickets and calculate their average ARR. Multiply the estimated affected population by that average ARR. This gives you a conservative revenue exposure estimate. For themes disproportionately affecting enterprise customers, the real number is likely higher because enterprise customers are the least likely to submit tickets (they find workarounds or escalate through their CSM).
My support team does not tag tickets consistently. How do I fix this?
The most reliable fix is removing the dependency on human tagging entirely. AI synthesis tools (Enterpret, Squad AI, BuildBetter) ingest raw ticket text and generate themes automatically, without requiring support agents to tag anything. The secondary fix, if you want human-tagged themes as well, is to make tagging a one-click action embedded in the support agent's existing workflow, not a separate step. And the structural fix is to tie a small element of the support team's performance metric to tagging quality, which changes the incentive.
How do I handle the translation between support language and product language?
Create a shared template that bridges the two. The template should ask: what was the customer trying to do (the job), what stopped them (the friction), what did they do instead (the workaround), and which accounts does this affect (the revenue context). This translation work should be someone's explicit responsibility, not something that happens informally. In teams without a product operations function, this is typically the PM's job, but it should be scheduled and repeatable, not ad hoc.
How often should this workflow run?
Continuous ingestion and clustering should run in the background at all times. The review of themes for routing decisions should happen at a defined cadence: weekly for high-volume themes, fortnightly or monthly for strategic theme reviews that feed into the roadmap planning cycle. The biggest mistake is treating this as a quarterly exercise rather than a continuous input.
How do I get leadership to invest in this?
Present the revenue at risk calculation (ticket count times 26 times average ACV) for the top three themes currently sitting unaddressed in your backlog. For most product teams, this number is large enough that it does not require further justification. The conversation shifts from "should we invest in this?" to "which of these three themes should we address first?"
Sources: TARP Research for the White House Office of Consumer Affairs (1976, replicated 1999); Lee Resources International complaint iceberg data; Pragmatic Institute State of Product Management 2025; Airtable Product Management Trends 2026; Enterpret support ticket analysis guide (June 2026); Stackademic LLM-powered ticket analysis (July 2026). Last updated: August 2026 · meetsquad.ai
Squad’s building towards a world in which anyone can develop and manage software, properly.
Join us in building user-centric products that deliver on your bottom line.